RSVLM-QA: A Benchmark Dataset for Remote Sensing Vision Language Model-based Question Answering
Visual Question Answering (VQA) in remote sensing (RS) is pivotal for interpreting Earth observation data. However, existing RS VQA datasets are constrained by limitations in annotation richness, question diversity, and the assessment of specific reasoning capabilities. This paper introduces Remote Sensing Vision Language Model Question Answering (RSVLM-QA), a new large-scale, content-rich VQA dataset for the RS domain. RSVLM-QA integrates several well-known RS segmentation and detection datasets, namely WHU, LoveDA, INRIA, and iSAID. We employ an innovative dual-track annotation generation pipeline. Firstly, we leverage Large Language Models (LLMs), specifically GPT-4.1, with meticulously designed prompts to automatically generate a suite of detailed annotations including image captions, spatial relations, and semantic tags, alongside complex caption-based VQA pairs. Secondly, to address the challenging task of object counting in RS imagery, we have developed a specialized automated process that extracts object counts directly from the original segmentation data; GPT-4.1 then formulates natural language answers from these counts, which are paired with preset question templates to create counting QA pairs. RSVLM-QA comprises 13,820 images and 162,373 VQA pairs, featuring extensive annotations and diverse question types. We provide a detailed statistical analysis of the dataset and a comparison with existing RS VQA benchmarks, highlighting the superior depth and breadth of RSVLM-QA's annotations. Furthermore, we conduct benchmark experiments on Six mainstream Vision Language Models (VLMs), demonstrating that RSVLM-QA effectively evaluates and challenges the understanding and reasoning abilities of current VLMs in the RS domain. We believe RSVLM-QA will serve as a pivotal resource for the RS VQA and VLM research communities, poised to catalyze advancements in the field. The dataset, generation code, and benchmark models are publicly available at https://github.com/StarZi0213/RSVLM-QA.
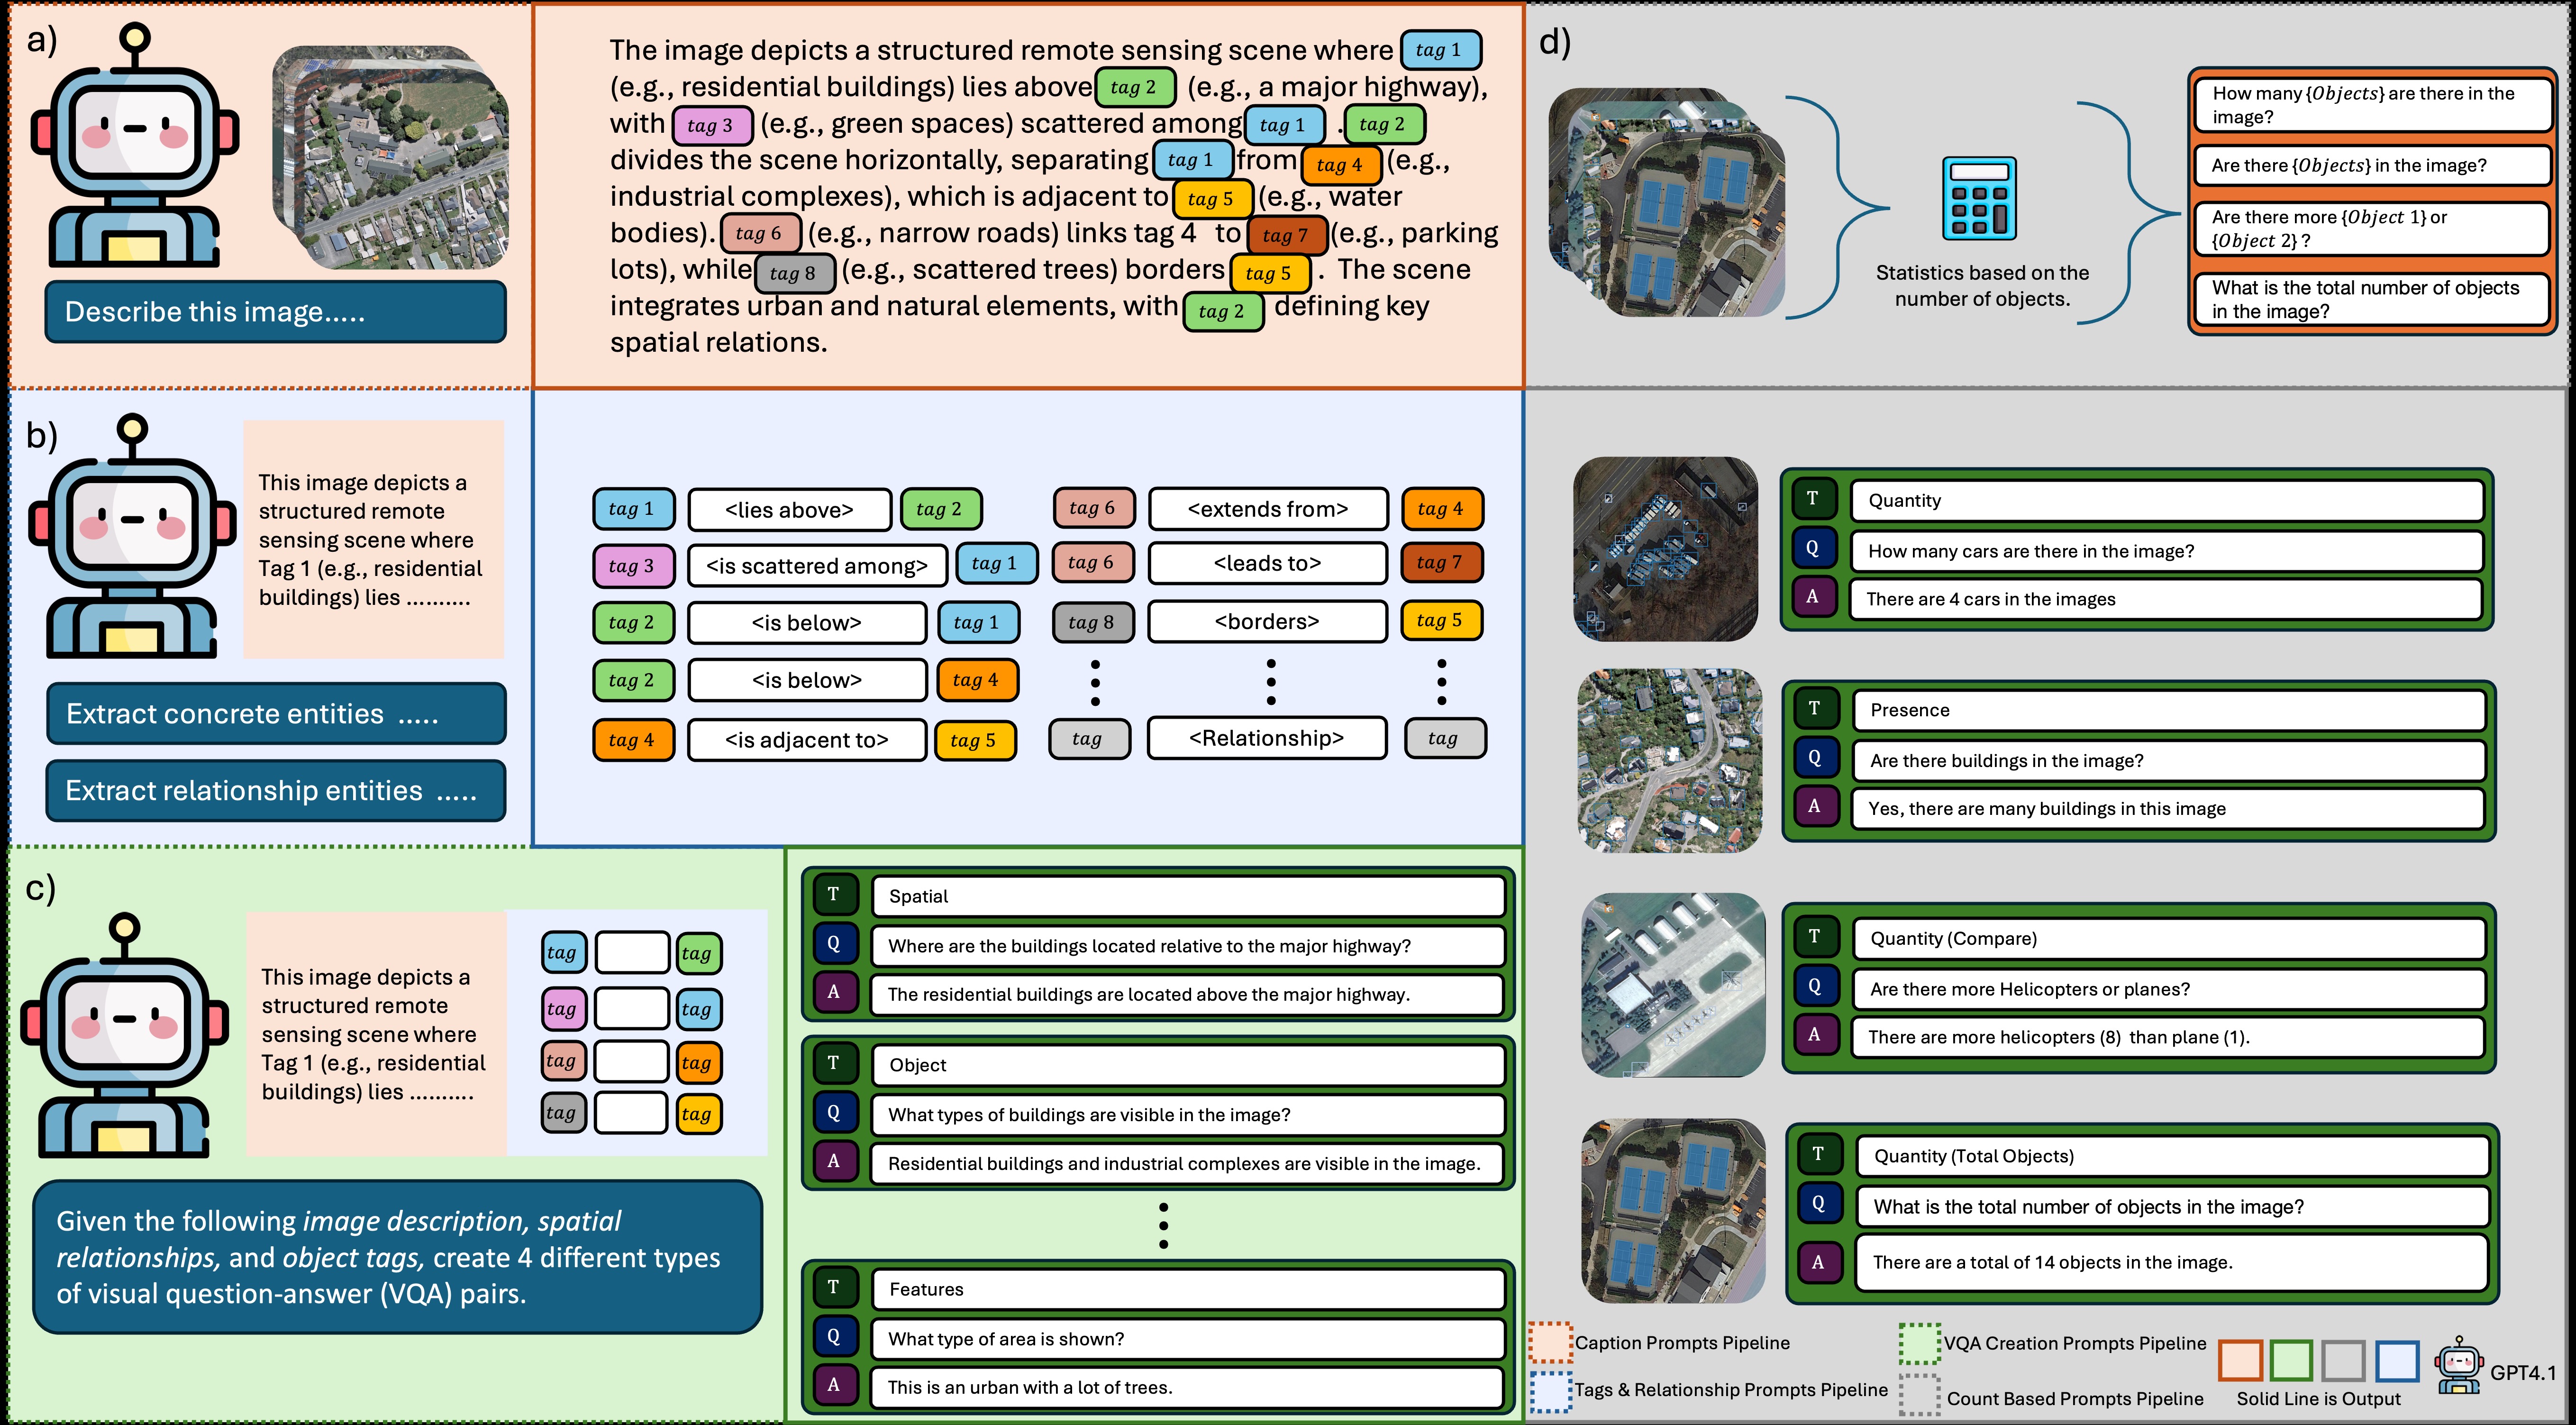
Figure: Overview of the RSVLM-QA dataset generation pipeline, illustrating the multi-stage process from image description to VQA pair creation.
Generation & Evaluation Prompts
| Dataset Name | # Images (Approx.) | # VQA/Caps (Approx.) | Annotation Method | Caption | Caption Length | Object Recog. | Feature Underst. | Spatial Rel. | Precise Count | Existence Judg. | Answer Style (NL) |
|---|---|---|---|---|---|---|---|---|---|---|---|
| RSVLM-QA (Ours) | 13.8k | 162k VQA | GPT-4.1+GT¹+Manual Review | Paragraph | |||||||
| RSVQA-HR | 10.7k | 1M+ VQA | Algorithm | nacap | |||||||
| RSVQA-LR | 0.8k | 77k VQA | Algorithm | nacap | |||||||
| CRSVQA | 1k | 10k VQA | Manual | nacap | |||||||
| RSVQAxBEN | 159k | 1.5M+ VQA | Algorithm | nacap | |||||||
| TAMMI | 2.2k | 22k VQA | Hybrid (Auto+Manual) | nacap | |||||||
| LRS-VQA | 1.7k | 7k VQA | Manual | nacap | |||||||
| VRSBench | 29.6k | 123k VQA + 30k Cap. | GPT-4 + Manual Review | Paragraph | |||||||
| Captioning-focused Datasets (primarily for caption generation, not VQA tasks like Object Recog., Count, etc.) | |||||||||||
| RSICD | 10.9k | 55k Captions | Manual | Short | |||||||
| UCM-Captions | 2.1k | 10.5k Captions | CNN+RNN | Short | |||||||
| Sydney-Captions | 0.6k | 3k Captions | CNN+RNN | Short | |||||||
| RSICap | 2.6k | 0.9k Caption Pairs | Manual | Paragraph | |||||||
| ChatEarthNet | 173k | 173k Captions | ChatGPT + Manual Review | Paragraph | |||||||
| BRSIC | 10.9k | 55k Bilingual Captions | Manual+GPT+Manual | Short | |||||||
| RSICC/LEVIR-CC | 5.1k | 10k Change Captions | Manual | Short | |||||||
Table Notes:
Symbols: ✓: Fully supports/present; ✗: Does not support/absent; ◑: Partially supports/limited extent; N/A Cap: No caption or not applicable for caption length; N/A Feat: Not a primary focus for this dataset type.
NL: Natural Language.
GT: Ground Truth.
(Class.): Counting presented as a classification task.
(Short): Answer style is short phrases/words, or caption is a short sentence.
(Cap.): Answer style refers to caption generation, not VQA response.
(Bilingual): Captions are provided in two languages.
(Change): Captions describe changes between bi-temporal images.
1: LLM for rich annotations & VQA; Ground Truth for precise counting.
2: Question types extremely limited (Land cover presence/name only).
3: Focus on large-size remote sensing imagery perception.
4: High-quality human-verified; Multi-task (Caption, VQA, Referring expressions).
5: High-quality detailed captions, but small scale.
6: Large scale; Focus on land cover description, not discrete objects.
7: Focus on describing changes between bi-temporal images.
Overall Statistics
| Metric | Value |
|---|---|
| Total Images | 13,820 |
| Total VQA Pairs | 162,373 |
| Question Types | 6 |
| Vocabulary Size (Unique Words) | ~5,700 |
| Avg. Relations per Image | 5.63 |
| Avg. Tags (Entities) per Image | 10.62 |
| Avg. Question Length (words) | 9.23 |
| Avg. Answer Length (words) | 18.80 |
| Total Caption Sentences | 62,539 |
| Avg. Sentences per Caption | 4.67 |
| Avg. Caption Length (words) | 124.25 |
Structured Annotations (Relations and Tags)
| Type | Total | Avg. per Image | Median | Max | Min |
|---|---|---|---|---|---|
| Relations | 77,823 | 5.63 | 6 | 19 | 1 |
| Tags (Entities) | 146,814 | 10.62 | 11 | 29 | 1 |
VQA Pair Distribution by Type
| Category | Total VQA Pairs | Avg. Q Length | Avg. A Length |
|---|---|---|---|
| Spatial | 39,467 | 10.58 | 12.35 |
| Quantity | 40,914 | 9.25 | 10.45 |
| Presence | 27,608 | 7.17 | 5.17 |
| Features | 26,634 | 9.95 | 13.58 |
| Objects | 13,930 | 10.30 | 10.81 |
| Captions | 13,820 | 7.00 | 107.82 |
| Total | 162,373 | 9.23 | 10.58* |
* The 'Total' for 'Avg. A Length' excludes the 'Captions' category due to its significantly different answer length characteristic, providing a more representative average for other VQA types.
Question Type Distribution Visualized
VQA Pairs by Type (Pie Chart)
VQA Pairs by Type (Bar Chart)
Average Scores (All Categories):
Average Scores (Excluding Caption):